Overview
The datasets contain RGB images of Arabidopsis thaliana plants from two experiments, structured by ecotype and replicate. The first two datasets, plant_ds1 and plant_ds2, include raw images, manually labelled masks, and colour-segmented versions, totalling 14,108 and 18,559 images, respectively. Plant_ds3 contains 70,927 tightly cropped images without labels. Manual labelling was performed using a sophisticated labelling tool supported by AI, combining automatic and manual corrections. These datasets support image processing, deep learning, plant health assessment, and agricultural research.
Data Folder Structure
Two experiments were conducted (data collection), yielding raw RGB images of different Arabidopsis ecotypes, accessions_dataset1_raw(plant_ds1) and accessions_dataset2_raw (plant_ds2). Each of the two datasets has the identical folder structures: ecotype_name/rep_YY, where ecotype_name is an identifier such as Col-0, TOU-I-17, or Wt-5, and YY is a double-digit number corresponding to a replicate number. Each replicate consists of a sequence of images capturing plant growth over the experimental period.
Aside from the raw images, two manually labelled datasets are also provided,accessions_dataset1_labels (plant_ds1) and accessions_dataset2_labels (plant_ds2). These two datasets contain whole plant masks as well as plant colour-segmented images (with the background suppressed) where the manually generated mask is applied to the raw image. Each dataset is stored in the same folder as the corresponding raw RGB image dataset, and both labelled datasets follow the same folder structure.:ecotype_name/rep_YY, where ecotype_name is an identifier such as Bch-4, Ler-1, orWs-2, and YY is a double-digit number corresponding to a replicate number. Each replicate folder in the dataset with labels contains two sub-folders:
• masks: the whole plant masks (binary image) corresponding to each raw (original) colour image.
• segmented_images: the colour-segmented images where a manually labelled mask is applied to the raw RGB image of the plant. Everything inside the plant area has the original, coloured pixels, and everything outside the plant area is black.
The first dataset (plant_ds1) consists of 14,108 raw RGB images, along with an equal number of corresponding labels (masks) and colour-segmented images, totalling 28,216 masks and segmented images combined. The second dataset (plant_ds2) contains 18,559 raw RGB images, with the same number of corresponding labels (masks) and colour segmented images, resulting in a total of 37,118 masks and segmented images combined.
Figure 1A and Figure 1B represent a visual representation of the folder structure for the two raw RGB datasets, as well as the visual representation of the folder structure for the corresponding labelled datasets.
The folder structure of Arabidopsis Dataset 1 consists of raw RGB plant images and their corresponding labels

Figure 1A. Folder structure for Dataset 1, including corresponding masks and segmented images
The folder structure of Arabidopsis Dataset 2 consists of raw RGB plant images and their corresponding labels

Figure 1B. Folder structure for Dataset 2, including corresponding masks and segmented images
The third dataset (plant_ds3) contains tightly cropped raw RGB images of two Arabidopsis ecotypes. It follows the same structure as the first two datasets. However, corresponding manual labels have not been generated. This dataset consists of 70,927 tightly cropped RGB images. Figure 2 shows the visual structure of the third raw RGB dataset.
The folder structure of Arabidopsis Dataset 3 consists of raw RGB plant images

Figure 2. Folder structure for the third raw RGB datasets consisting of two Arabidopsis ecotypes.
Plant Canopy Labelling
The plant canopy for individual plants was manually labelled using segments.ai. Each leaf was individually selected by drawing bounding boxes around it, as shown in Video 1. Then, the tool allowed an option to automatically identify the leaf that was wholly enclosed in the bounding box and generate its mask, as marked in Video 1 with a bright colour.
After all leaves (whole plant canopy) were automatically segmented, manual adjustments can be made to include unusual or partially covered leaves or to remove excess mask areas. The automatically segmented plant canopy is displayed as a semi-transparent bright mask, while manual corrections are applied in real time using a bright colour. The final plant mask is shown as a brown overlay on top of the plant, while the actual plant mask is stored as a white area on a black background.
Video 1. Demonstration of plant canopy labelling using a sophisticated AI-based tool
Figure 3 below presents two examples from the plant_ds1. The first row of each example shows the raw RGB images, the second row displays the corresponding plant masks, and the final row shows the colour-segmented images. The first example features a healthy plant (A). The second example depicts a plant that became stressed at the end of the experimental time, as indicated by the yellow leaves (B).
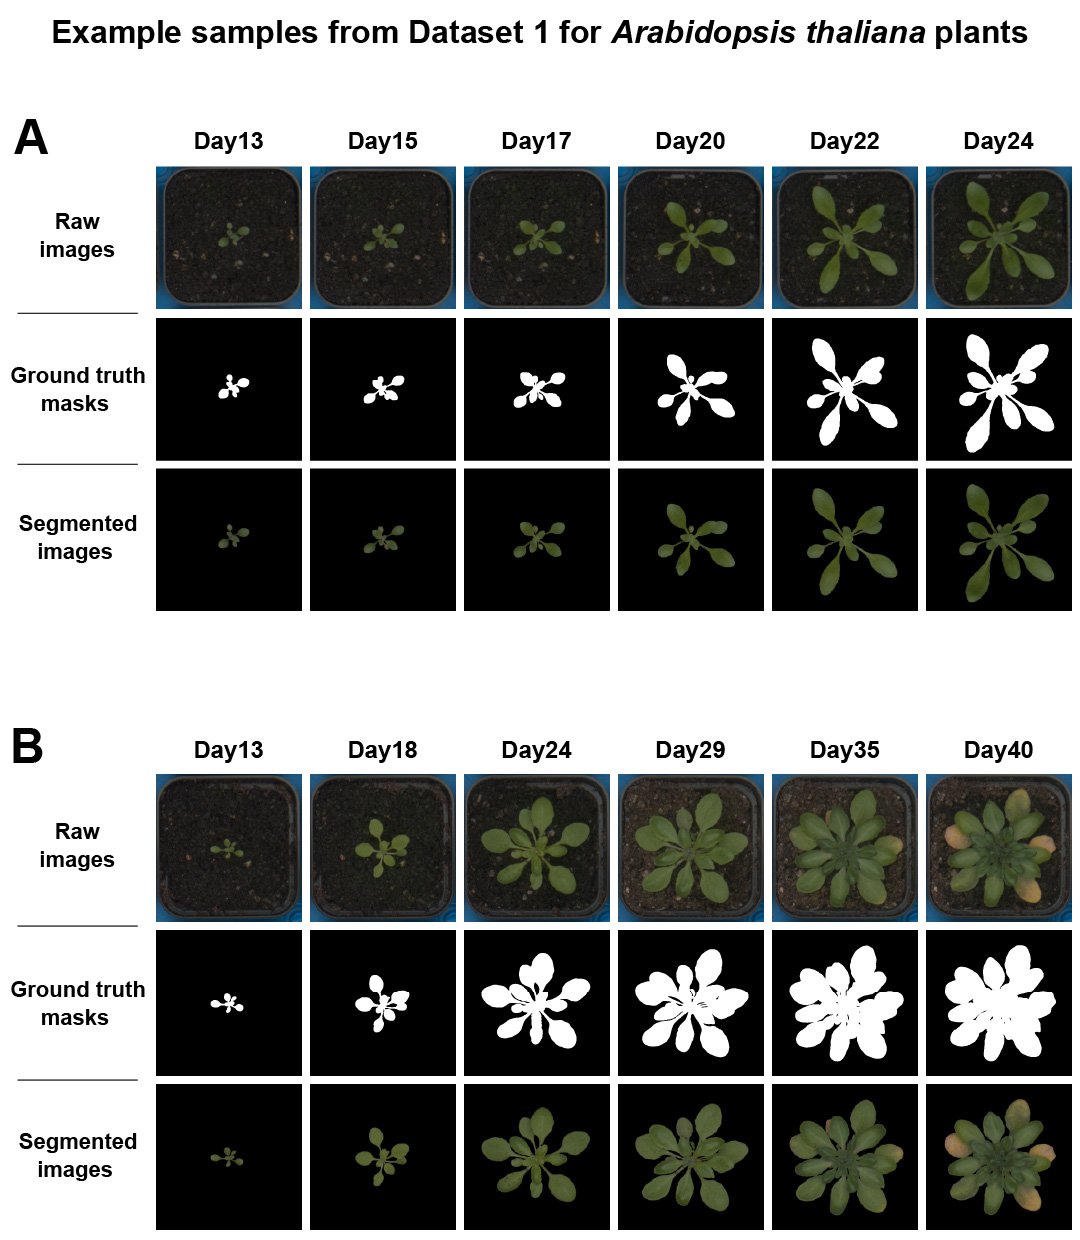
Figure 3. Raw RGB images and masks/segmented images available in plant_ds1 dataset
Figure 4 presents two examples from the plant_ds2 dataset. The first row of each example shows the raw RGB images, the second row displays the corresponding plant masks, and the final row shows the colour-segmented images. The first example features a healthy plant (C). The second example depicts a stressed plant (D), as indicated by the purple leaves (D).
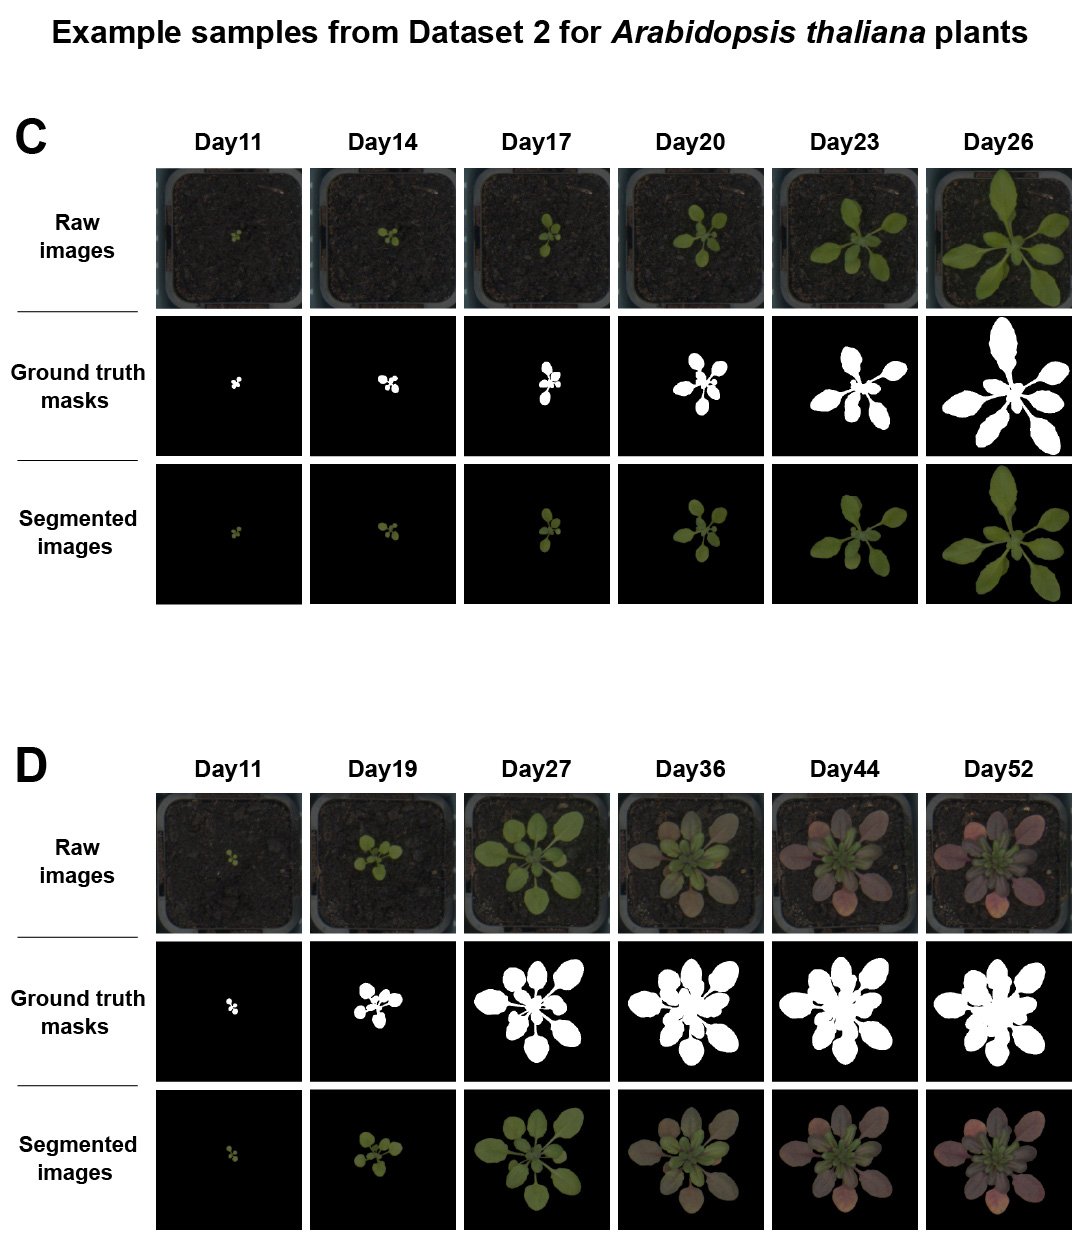
Figure 4. Raw RGB images and masks/segmented images available in plant_ds2 dataset
Datasets applications
The raw RGB image datasets plant_ds1 and plant_ds2 are well-suited for direct image processing tasks such as image segmentation, plant traits extraction, and statistical analyses. These datasets provide valuable input for a variety of applications, including plant health assessment and environmental monitoring. The labelled data, which contains manually annotated ground truth data, can be leveraged for more advanced purposes. They are suitable for training, testing, validating, and re-training deep learning models. These models can be customised for diverse tasks, including plant segmentation, stress detection, and growth prediction, making them highly applicable to fields such as high-throughput plant phenotyping and precision agriculture. Additionally, the datasets can support research in crop improvement, plant development, and ecological studies, offering a foundation for developing AI-driven solutions to address agricultural challenges.
Note
Being manually generated using the sophisticated labelling tool, the labelled data are generally accurate. However, in a very limited number of cases, some Arabidopsis leaf blades have missing stems (i.e., they are not connected to the rest of the plant). This is because the stems were too thin, their colour was too blurred, or the plant was too small, which introduced uncertainties into the segmentation process. Data postprocessing techniques can be used to correct minor inconsistencies.
Copyright Notice
© 2025 La Trobe University. All rights reserved.
These datasets are made available for research and teaching purposes under the following conditions: When using these datasets, you agree to properly cite the following two publications:
1. ____
2. ____
While these datasets can be used and reproduced in non-commercial academic and research publications with proper citation, it must not be redistributed, republished, or hosted publicly in any form. By downloading or using these datasets, you acknowledge and will comply with the stated citation requirements.