Overview
Leaf datasets were generated based on experiments 1 and 2 (data collection) of specifically selected Arabidopsis thaliana ecotypes. Three datasets are provided:
• leaf_dataset_colour - raw RGB images and corresponding individual leaf labels of different colours
• leaf_dataset1 and leaf_dataset2 – leaf level masks
The datasets are structured hierarchically by ecotype and replicate, with detailed annotations achieved using the sophisticated labelling tool, including estimations of hidden leaf parts and leaf tracking. These datasets are designed for plant and leaf statistics extraction and machine learning applications such as ecotype identification, leaf growth pattern analysis, and canopy density estimation.
Data Folder Structure
Multi-colour leaf labels
The leaf_dataset_colour dataset contains two folders: raw_dataset and leaf_labels. The structure of the first folder raw_dataset, includes sub-folders named ecotype_name/rep_YY, which contain the raw RGB images of 21 Arabidopsis ecotypes, each with at least 4 replicates, and in some cases, more than 30 replicates. The hierarchy of the second folder, leaf_labels, ecotype_name/rep_YY, contains the combined masks of individual leaves. In the combined leaf masks, all individual leaf masks are represented together, each of them by a different colour. The leaf colour is unique and remains constant throughout the entire plant growth cycle. The ecotype_name and rep_YY sub-folders here have the same meaning as in the case of the plant-level datasets. Pre-defined unique colours for each leaf, along with their corresponding RGB values, are available in the main folder of this dataset (Excel format).
This dataset contains 17,082 raw RGB images, along with the same number of corresponding individual leaf masks labelled with pre-defined colours. Figure 1A shows the structure of the two leaf_dataset_colour sub-folders.
Individual leaf masks
The leaf datasets represent the masks of individual leaves from each plant, at each point in time. The leaf datasets follow the structure of the raw image data. They are stored hierarchically under leaf_datasetX/ecotype_name/rep_YY folder paths, where X is 1 for dataset 1 and 2 for dataset 2, ecotype_name is any of the many Arabidopsis ecotype names used, such as Ba4-1, Kz-9, Zdr-1, etc., and YY is the double-digit number corresponding to a given replicate number.
For each replicate, the leaf masks are stored individually in their own Leaf_ZZ folders (where ZZ is a double-digit number associated with the leaf number), and they contain only masks from the range of timestamps where the respective leaves exist.
There are four sub-folders for each leaf of each replicate:
• hidden leaf mask seq: includes all leaf masks from the commencement of the screening period until the leaf is completely occluded by a superseding leaf and no longer appears visible for the remainder of the experimental time. In such cases, the time points during which the leaf is hidden are still labelled if the leaf appears again (gap between disappearance and re-appearance). The hidden leaf area is manually estimated during the individual leaf labelling process. If the leaf does not appear again, its appearance is considered to have stopped. All leaf masks are binary, with the leaf area marked in white and everything else in black.
• hidden stem mask seq: Contains all stem masks of the corresponding leaf from the hidden leaf mask seq folder.
• leaf mask seq: The content is the same as hidden leaf mask seq, but contains only the timestamps where the leaf is visible.
• leaf crop seq: The colour-segmented leaf images extracted by using the corresponding masks in the leaf mask seq folder. Everything inside the leaf area has raw coloured leaf pixels, and everything outside the leaf area is black. As in the leaf mask seq folder, the leaf crop seq folder contains only the timestamps where the entire leaf or parts of the leaf are visible.
The leaf_dataset1 contains 45,133 hidden leaf masks over experimental time in total (distributed across 2,612 leaves across different replicates), and 44,297 visible colour segmented leaf images or visible leaf masks. The leaf_dataset2 contains 124,131 hidden leaf masks in total (distributed across 3,064 leaves across different replicates), and 121,015 visible colour segmented leaf images or visible leaf masks. Plant centres of each replicate of ecotypes available in both datasets are provided in separate Excel files.
Figure 1A shows the dataset structure for leaf_dataset1 and Figure 1B shows the dataset structure for leaf_dataset2.

Figure 1A. Folder structure of the raw RGB dataset (in green) and the individual colour leaf labels (in orange).

Figure 1B. Folder structure of the individual leaf masks, for both leaf dataset 1 and 2.
Leaf labelling
The manual labelling of each leaf was accomplished by using a special tool provided by the Computer Vision Annotation Tool (CVAT) available at cvat.ai. A polygon was manually drawn around the individual leaves, even when it was partially visible, to estimate the hidden parts. Any missing border part was drawn by taking into account the same border area from previous or subsequent frames (screening days). The mask for each leaf was shown with a semi-transparent effect, allowing users to see occluded regions clearly. This method provides a more complete representation of the leaf’s shape, even when portions were occluded by other leaves. By including both visible and estimated sections, the labelling captures the entire area of each leaf throughout the frames, ensuring accurate tracking of its position and size. This technique enhances the overall precision of the labelling process for occluded leaves.
The plant centre is the geometrical centre of the combined individual leaf masks. The leaf stems can then be computed as the line that connects the plant centre with the closest point on the leaf mask.
When a leaf was completely covered by another leaf, the hidden instances of that leaf were interpolated linearly between the nearest previously and subsequently visible leaves. First, the coordinates of the leaf centre were linearly interpolated between the closest visible leaves. Then, for each angle around the centre, the distance between the leaf centre and the leaf border was again linearly interpolated and added to the already interpolated leaf centre position. The resulting contour was used to create the intermediate hidden leaf mask.
Figure 2 shows example leaf masks and colour-segmented leaf images from leaf_dataset1 and leaf_dataset2. Figure 2A and 2D present the individual leaf masks. Figure 2B and 2E present the individual hidden leaf masks (which include the completely covered masks). Figure 2C and 2F present colour-segmented leaf images, generated using individual binary leaf masks.
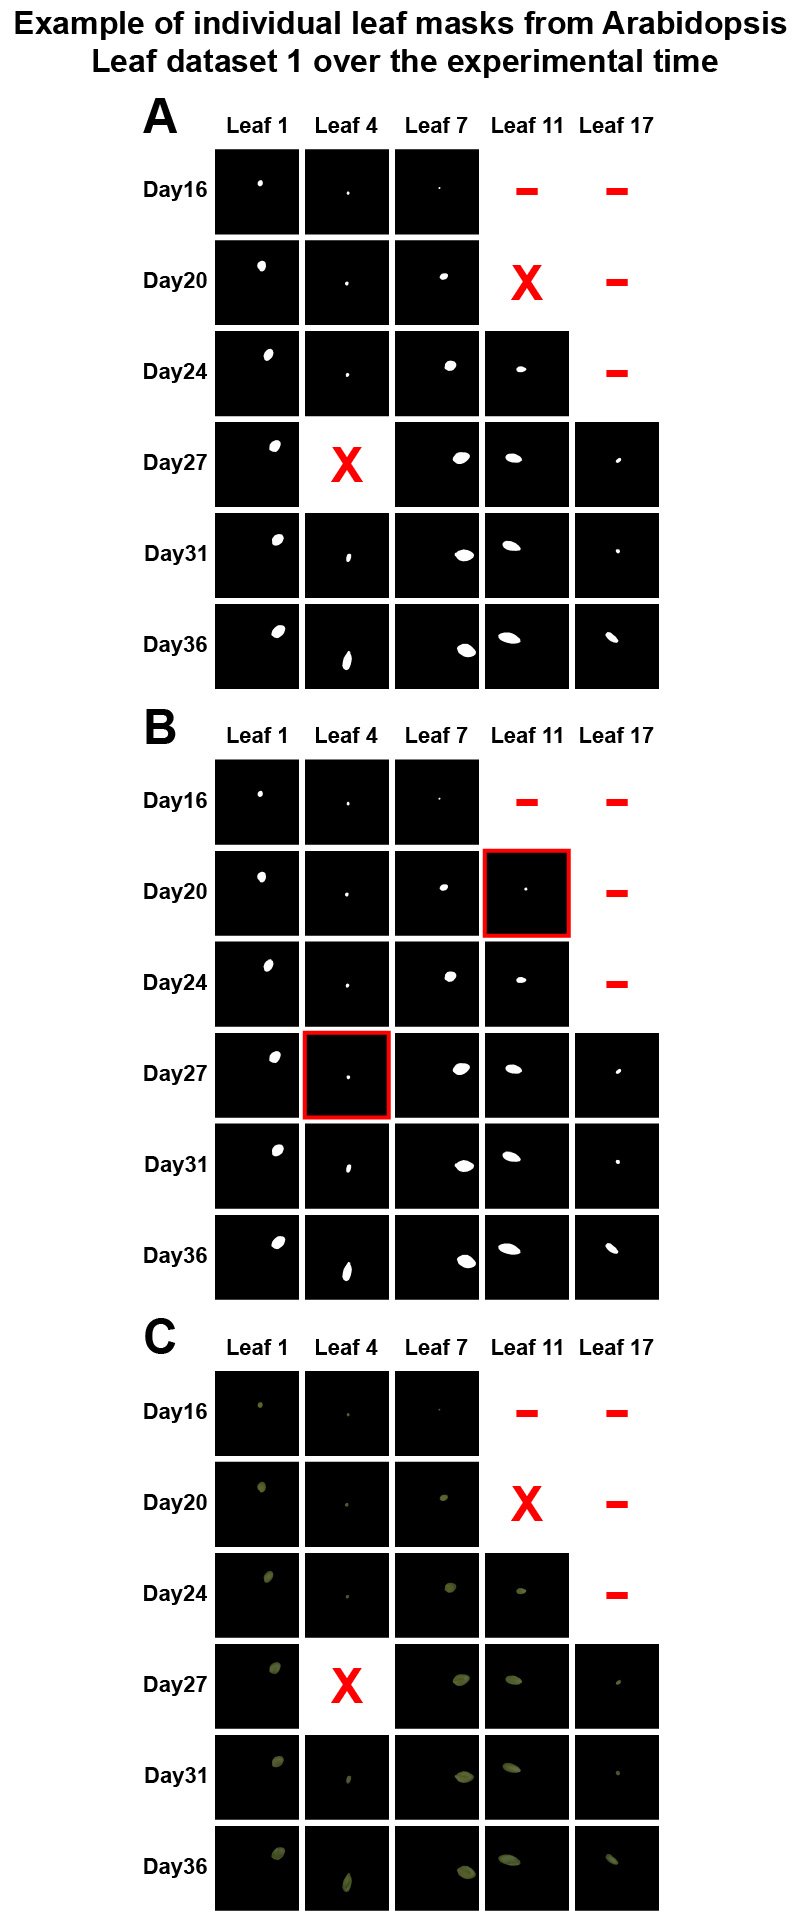
Figure 2. Individual leaf masks and colour-segmented leaf images from an ecotype in leaf_dataset1 and leaf_dataset2. (A) Leaf masks; (B) Hidden leaf masks; (C) Colour-segmented leaf images. The red X stands for an occluded leaf. Red dash stands for days outside the lifetime of the leaf.
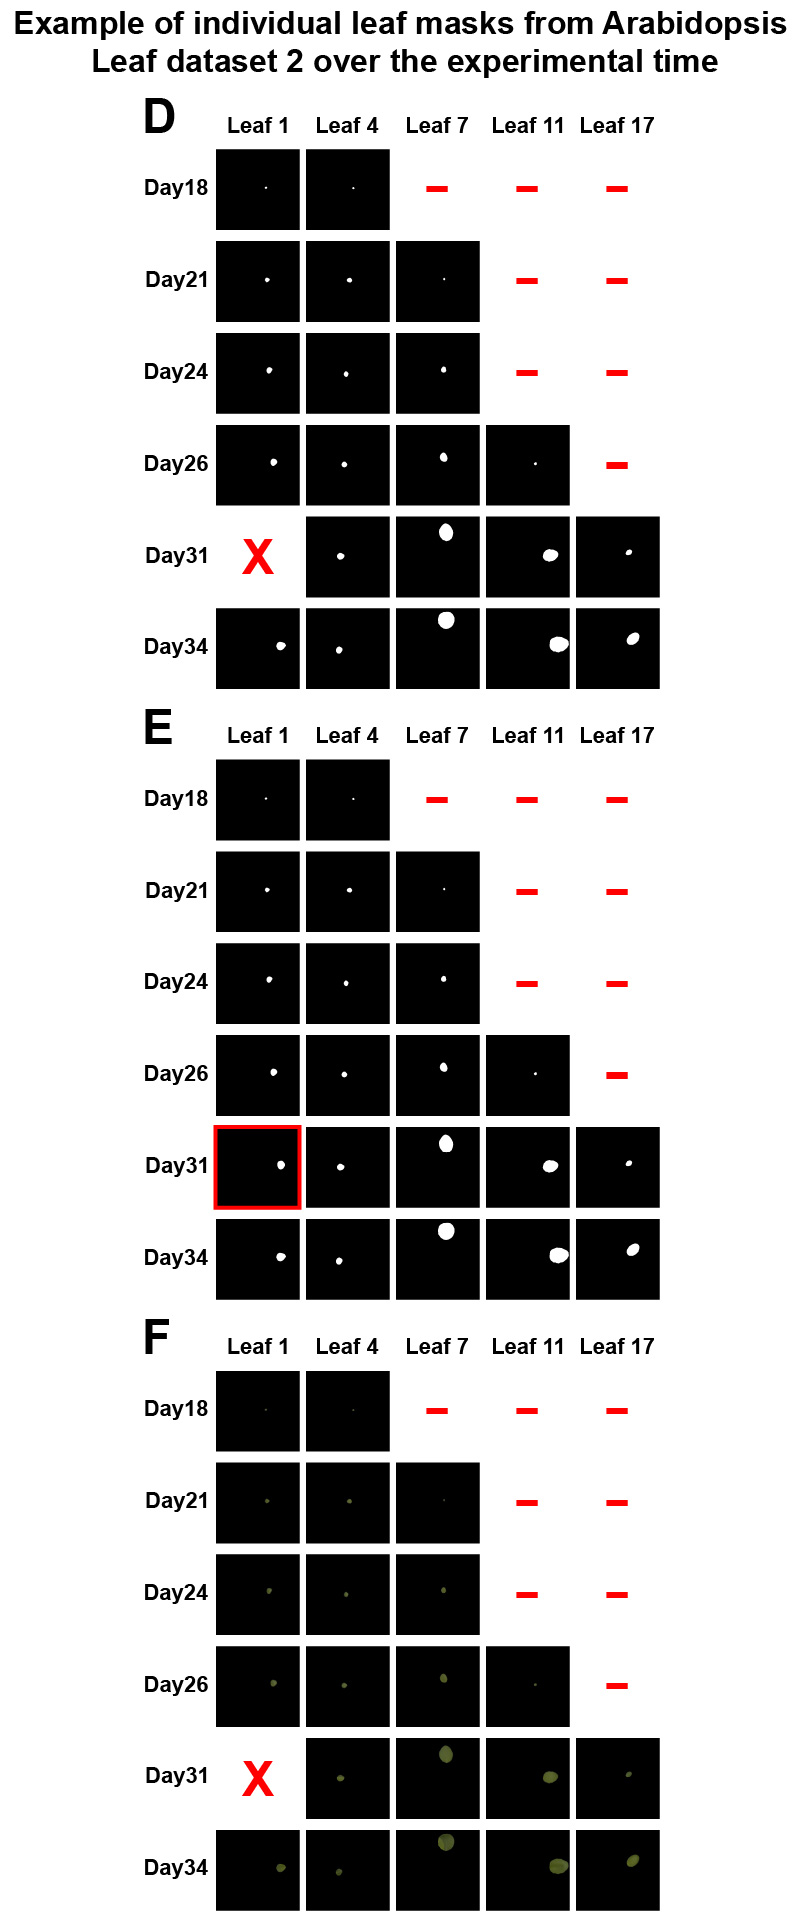
Figure 2. Individual leaf masks and colour-segmented leaf images from an ecotype in leaf_dataset1 and leaf_dataset2. (D) Leaf masks; (E) Hidden leaf masks; (F) Colour-segmented leaf images. The red X stands for an occluded leaf. The red dash stands for days outside the lifetime of the leaf.
Figure 3 shows raw plant images together with corresponding ground truth coloured leaves masks, as well as semi-transparent masks of individual leaves in leaf_dataset_colour.
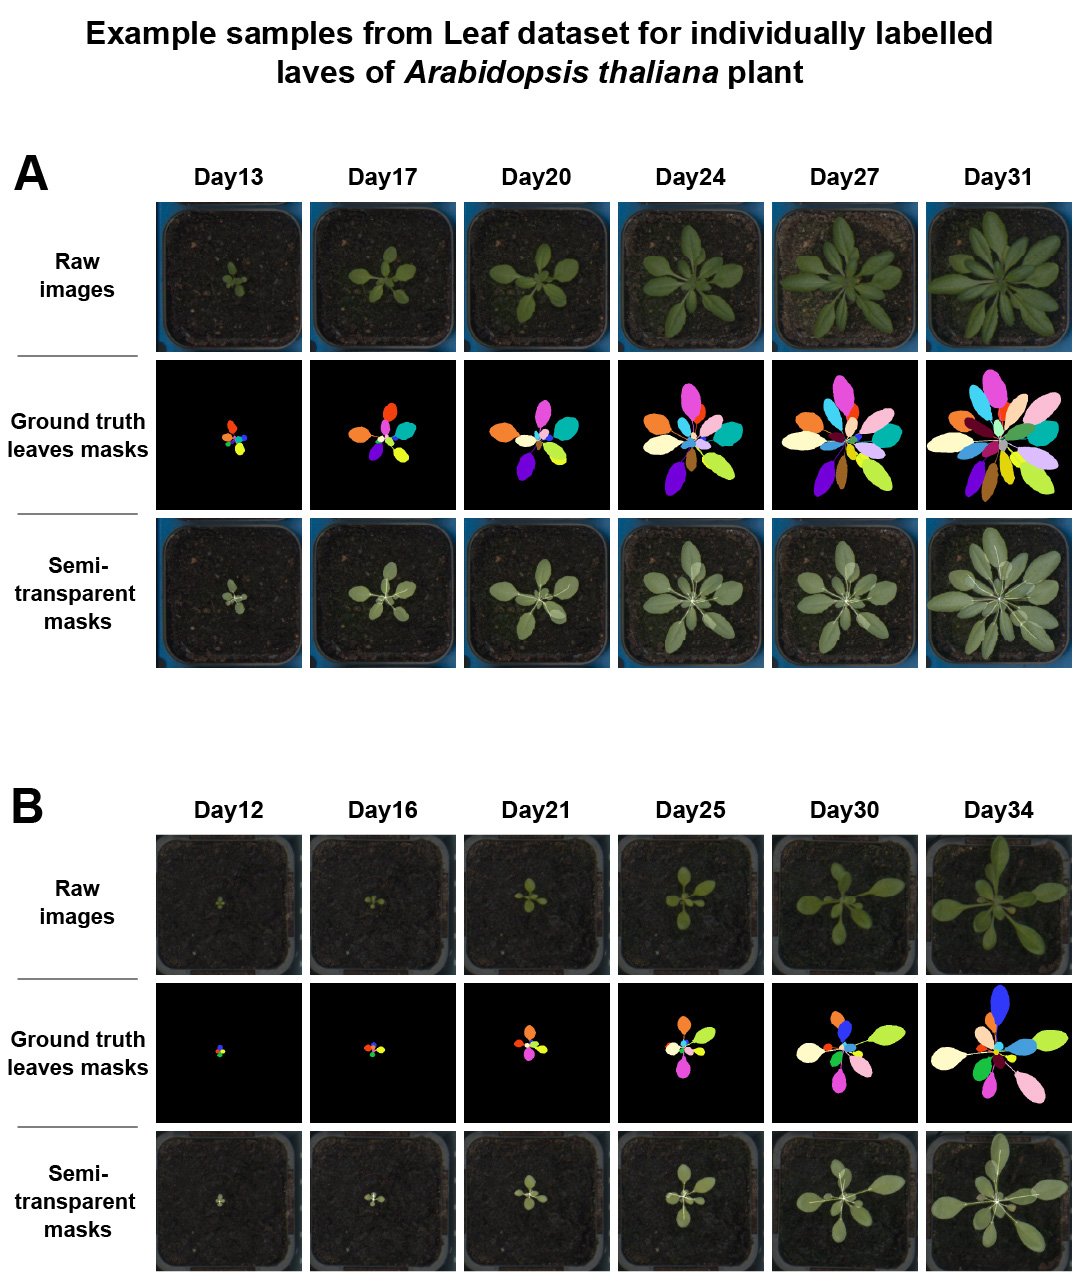
Figure 3. Example of raw images together with corresponding individual leaf labels and semi-transparent masks where leaf area is manually estimated.
Leaf tracking
In the CVAT tool, a red key point was used to track individual Arabidopsis leaves over time, ensuring accurate identification across frames. This tracking process involved manually clicking on each leaf mask to assign a key point, which remained associated with that leaf throughout the sequence of images. To maintain consistency, clicks should be placed within an area covered exclusively by the respective leaf, avoiding overlapping regions.
By marking key points in consecutive frames, the tool enables precise tracking of individual leaves, even when partially occluded or changing shape due to growth or movement. Figure 4 shows the tracking process, where the key points appear in light blue, serving as reference markers for each tracked leaf. The white lines provide an approximate visualisation of the leaf stems, helping to contextualise the placement of the tracked points and improving overall accuracy in monitoring leaf development.

Figure 4. Individual leaf tracking over experimental time using CVAT labelling tool.
Figure 5 represents an example of a single leaf where the red point is used to track it over experimental time.
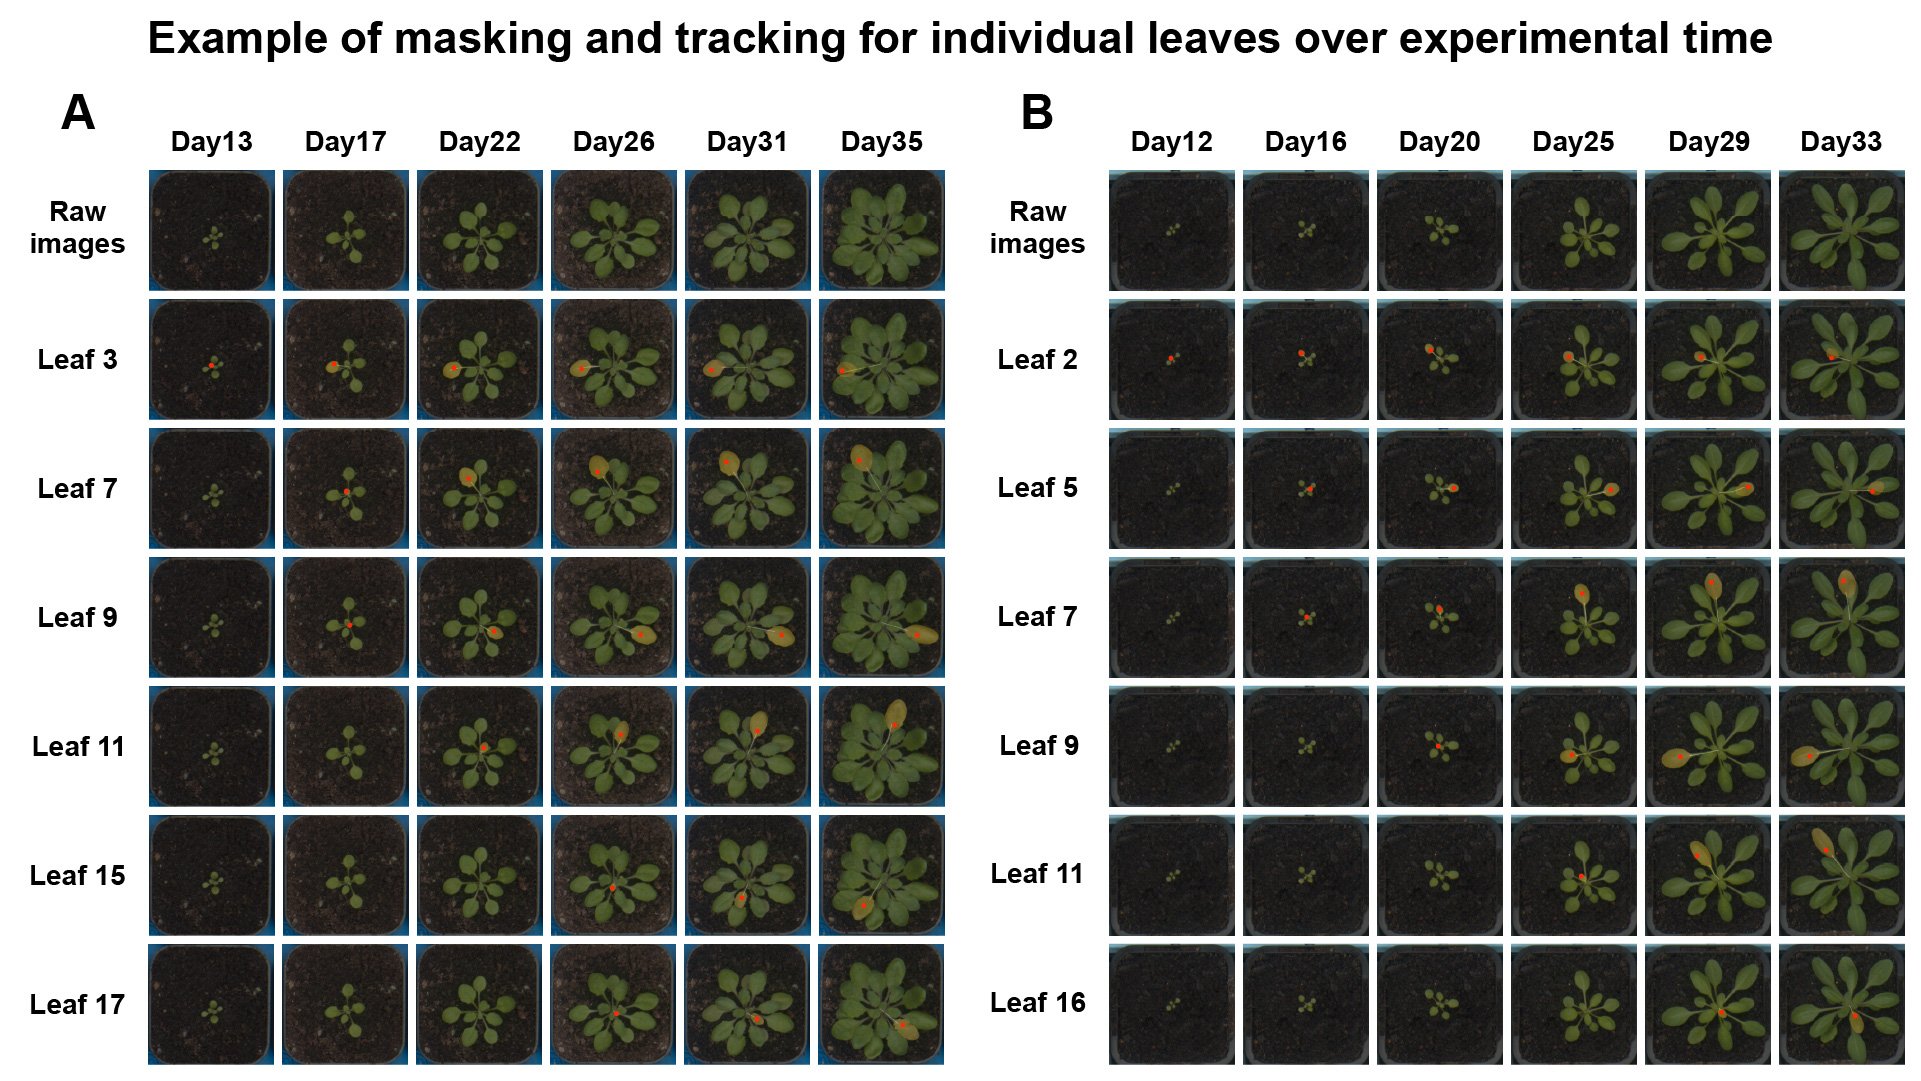
Figure 5. Individual leaf tracking of two Arabidopsis ecotypes over experimental time.
Leaf Elevation
Newer leaves always grew above the older ones if they grew in the same direction. Therefore, the date and time when a leaf first appeared determine its elevation (i.e., its relative distance from the ground). Elevation is a relative parameter because it does not measure an exact distance but rather the occlusion order of leaves from the ground up. This facilitates the labelling process by helping to determine which leaves are visible from a top-view of the plant. At the same time, it also reveals whether any leaves are completely hidden underneath.
The leaf elevation was also used to create the coloured masks of individual leaves, where each leaf gets drawn with a unique colour that remains constant throughout the lifetime of the ecotype replicate. By assigning each leaf a unique colour ID and drawing them in order of increasing elevation, the final result shows the combined leaf labels as they appear from the top-view of the plant.
Dataset applications
The datasets can be used for various purposes, as outlined below. Given their size and complexity, generated data are best suited for automated, script-based analysis.
Plant and leaf statistics
Leaf statistics at different growth stages can be extracted from the leaf masks, as the start and end frames of each leaf are known. Statistics about derived measurements can then be calculated by first computing extra traits, such as convex hull, enclosing circle, enclosing ellipse, leaf mid-vein, etc. Overlapping percentages with other leaves can also be determined.
Similar calculations can be performed by combining individual leaf masks. Direct measurements, such as plant area, convex hull, perimeter, circle bounding box area and similar, can be extracted directly from the plant mask. Derived plant-level measurements, such as eccentricity, roundness, isotropy and Leaf Area Index (LAI) can be further computed and provide insights into plant development over time.
The coloured leaf labels can only be used for plant-level measurements, or visible leaf measurements, since the occluded leaves (or leaf parts) are not accessible. For precise leaf-level measurements, individual leaf masks (binary masks) should be used.
Machine learning
The provided datasets are well-suited for machine learning and deep learning applications, particularly for training different deep learning models for various computer vision tasks, as they include a large number of manually created ground truth masks. The two leaf datasets can be especially useful for models aimed at identifying ecotypes based on leaf shapes or positions, studying temporal leaf growth patterns, performing tracking of individual leaves, predicting leaf health status, and estimating canopy density.
Note
Although the data has been carefully prepared and organised, occasional errors may still occur. However, these minor inaccuracies do not significantly impact the overall reliability of the dataset application in general. Minor examples of such errors include incorrect leaf masks due to inaccurate border drawing, misjudged leaf elevation, or swapped leaf colour IDs caused by insufficient image resolution, particularly for small leaves.
Copyright Notice
© 2025 La Trobe University. All rights reserved.
These datasets are made available for research and teaching purposes under the following conditions: When using these datasets, you agree to properly cite the following two publications:
1. ____
2. ____
While these datasets can be used and reproduced in non-commercial academic and research publications with proper citation, it must not be redistributed, republished, or hosted publicly in any form. By downloading or using these datasets, you acknowledge and will comply with the stated citation requirements.