Overview
Three indoor phenotyping experiments were completed to study Arabidopsis thaliana growth using advanced imaging systems. The first to use a high-resolution RGB camera to capture top-view images under controlled lighting and temperature. Automated cropping techniques ensured precise data preparation and organization. The third experiment employed multiple stereo cameras for comprehensive plant monitoring. Data underwent preprocessing to enhance quality, including colour correction and noise reduction. These structured datasets support research in plant segmentation, stress detection, and growth modelling.
High-Throughput Phenotyping System Specifications
Two large-scale phenotyping experiments were conducted at La Trobe University at AgriBio, the Centre for AgriBioscience, during 2022. The experiments took place in a controlled growth chamber equipped with a movable X-Y (horizontal-vertical) high-throughput plant phenotyping (HTPP) system that includes an adjustable-height table, designed and manufactured by Photon System Instruments (PSI). The indoor HTPP system features a specialised industrial camera, the GigE uEye UI-5580CP-C-HQ, equipped with a 1/2” colour CMOS sensor (MT9P006STC) that has 4.92 megapixels, a resolution of 2560 x 1920, a bit depth of 12 bits, and ISO values ranging from 142 to 1600. The experiments used an ultra-wide-angle lens from Samyang Optics Co. Ltd. with a 10 mm focal length, an aperture range of F2.8 to F22, and a focusing distance from infinity to 0.24 m. The camera and lens were mounted at the centre of the mobile illumination device to provide symmetrical lighting and minimise shadows in all directions within the growth chamber, as displayed in video 1. Illumination in the growth chamber is provided by three LED illumination sources that replicate natural light intensity and spectrum, covering red (660 nm), far-red (740 nm), and cool white (5700K) wavelengths. Prior to both experiments, the light intensity was measured and varied between 188 and 227 µE (micro Einsteins) at each position of the table. During screening, non-biological illumination is supplied by a custom device that emits diffuse white light at an intensity of 3.8 µmol/m²/s, evenly illuminating all pots within a tray positioned on the table. This lighting activates a few seconds before image capture and remains on during and shortly after acquisition, while the growth chamber's LED lights are automatically switched off to avoid any interference between the two light sources. The temperature of the growth chamber was set to 22°C during the daytime and 19°C during the nighttime for the planned experiments. Finally, image corrections were applied to ensure colour accuracy and minimal distortion, including white balance using calibration chart correction factors, linear colour correction aligning to Adobe RGB (1998) via a colour correction matrix, and barrel distortion correction.
Experiments 1 and 2
The design of the first experiment included 38 Arabidopsis thaliana ecotypes, each having 10 replicates, totalling 400 plants. Arabidopsis ecotypes such as Bch-4, Can-0, Col-0, Cvi-0, Sav-0, and other related ecotypes were grown in 4x5 trays and pots measuring 68x68 mm size and 95 mm depth, under a 10-hour light / 14-hour dark cycle. Plants were randomly shuffled in a tray, ensuring that each tray contained a unique arrangement of ecotypes. Top-view (canopy-based) RGB images were acquired 12 days after sowing (DAS) in a sequence, i.e., twice a day, with a 3-hour interval between each screening time. Before conducting the second experiment, the growth rate of the ecotypes used in the first experiment was analysed, and the eight best-performing ecotypes were selected for the second experiment. During the second experiment, the following Arabidopsis ecotypes were grown in 4x4 trays using pots measuring 65x65 mm size and 60 mm depth, with 40 replicates for each ecotype: Col-0, Cvi-0, Is-1, Kz-9, Ler-1, TOU-I-17, Uk-1, and Zdr-1. The photoperiod was identical to that in the first experiment, however, four RGB images per day were collected, using the 6-hour interval screening interval difference and 13 DAS. During both experiments, plants were constantly monitored, and if their leaves grew out of the camera scene, the corresponding pots were removed from the tray.
Video 1. Example of one screening round in a controlled growth chamber during both phenotyping experiments.
Data preparation and organization
Since the camera system scans trays of plants from a top view, aside from the main tray, the raw RGB images may include parts of other trays or the floor of the growth chamber. Data preparation, including auto-tray and -pot cropping, as well as file organization, is necessary to ensure adequate quality. Auto-tray cropping was established by using a set of coordinates (top-left and bottom-right parts of the image) that belong to the main tray visible in the RGB image. After that, cropped tray images were stored and organised based on the unique TRAY_ID in the growth chamber. Auto-pot cropping was established by randomly generating coordinates in the form of bounding boxes and manually positioning them around the pots of 4x5 or 4x4 experimental trays. Upon successful pot detection, a set of coordinates corresponding to each POT_ID was stored in a metadata file. Subsequently, the generated coordinates were loaded to execute the auto-pot cropping for each cropped tray image. Cropped pot images were stored in the following directory format Ecotype_name -> Rep_YY -> sequence of pot images, where YY is a double-digit number corresponding to a replicate number. After removing empty pot images and replicates that did not germinate, the total number of raw RGB images in the plant_ds1 dataset was 14,108, whereas the plant_ds2 dataset contained 18,559 structured images. Generated cropped RGB images were stored as PNG files, which allows lossless compression. The process of automating the cropping of trays and pots, as well as storing raw images in the database, is illustrated in Figure 2.
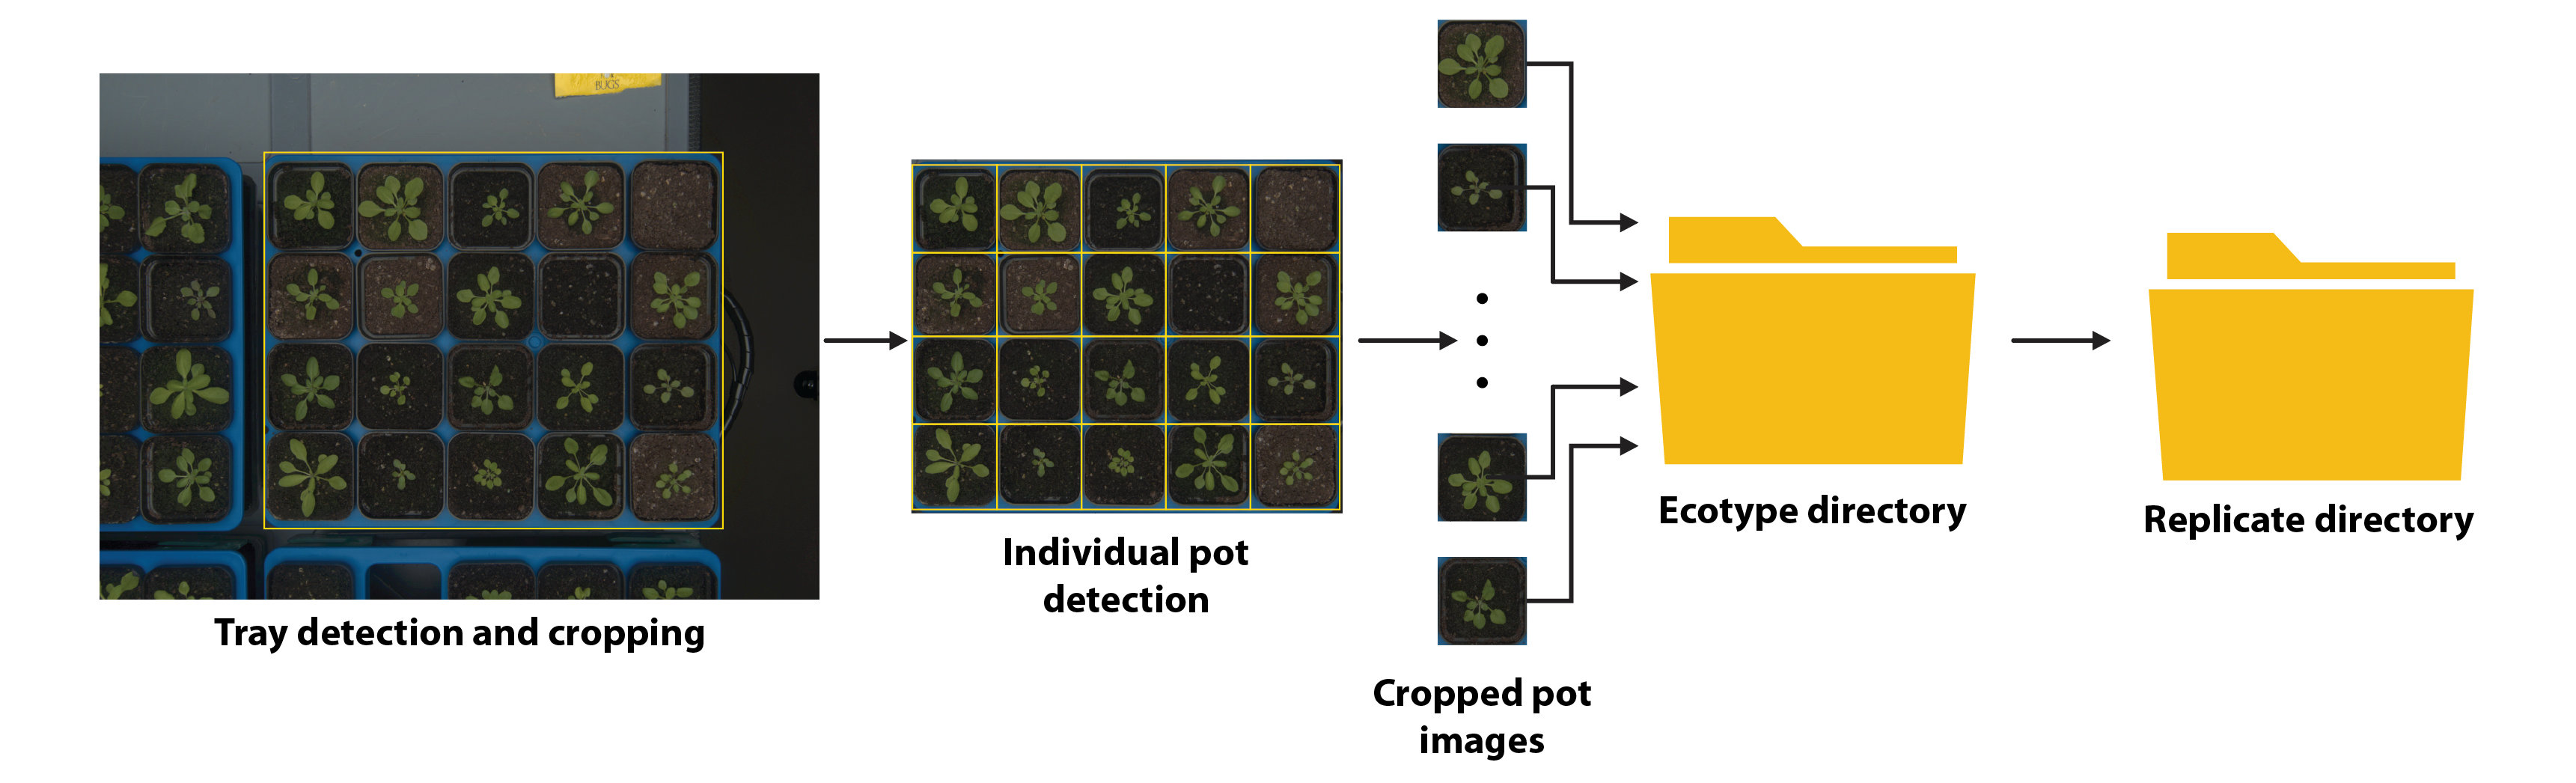
Figure 2. Automated cropping of trays and individual pots from raw RGB images, including the proper organization of files within directories.
Experiment 3
Another Arabidopsis dataset was generated at La Trobe University in 2019 to investigate temporal differences during plant development. Data acquisition was performed using an indoor HTPP growth chamber composed of 30 fixed stereo cameras installed to synchronously screen plants from different angles. Two of the most common Arabidopsis ecotypes, Col-0 and Cvi-0, were grown under a 14-hour light/10-hour dark cycle to simulate long-day conditions and 20⁰C with 50% humidity and watered every four days. The quality of the collected images required pre-processing, and then noise reduction and colour correction were performed manually by applying image processing algorithms. The experimental setup is demonstrated in Figure 3. More details about the aim and experiments can be found here.
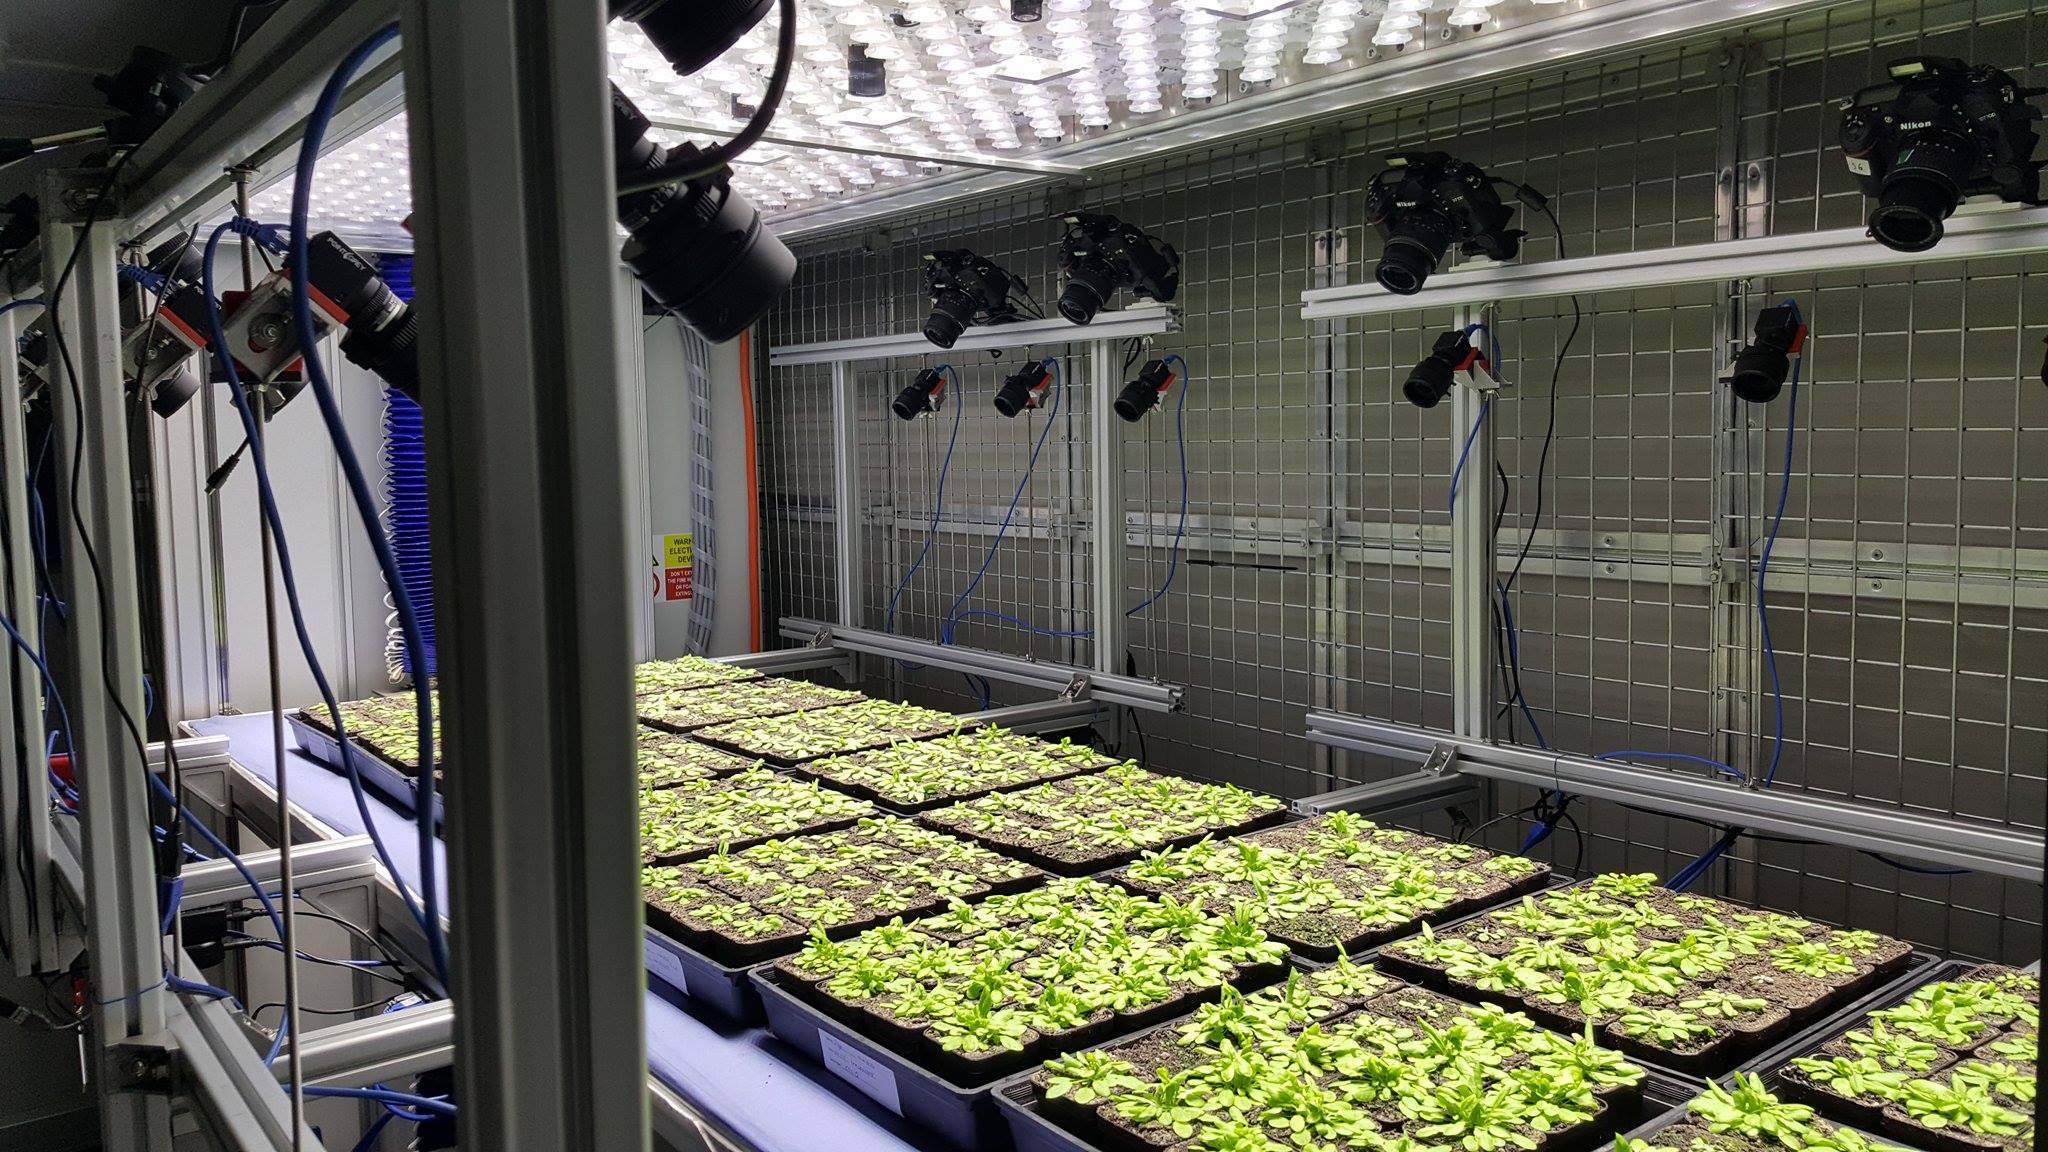
Figure 3. Growth chamber with a multiple-camera indoor phenotyping system design for extensive screening of Arabidopsis ecotypes.
Table 1. For the first two experiments, the day temperature was 22°C and night 19°C, while the average light intensity during the day varied between 184 to 228 (µE). In the third experiment, the day/night temperature was 20°C and light intensity during the day varied between 150 to 180 µE.
| Ecotypes | Total | Images per day | Acquired images | |
|---|---|---|---|---|
Experiment 1 | Ba4-1, Ba5-1, Bch-4, Br-0, C24, Cap-0, Col-0, Cvi-0, Ede-1, Edi-1, Et-6, Go-0, Hovdala-2, Hs-0, Hsm, Is-1, Jm-0, Kz-0, Ler-1, Li-5-2, Lz-0, MIB-28, Ot-0, Oy-0, PHW-2, Pro-0, Ren-11, Sav-0, TOU-1-17, TOU-J-3, Udu-1-34, Uk-1, Uk-4, Utrecht, Wil-2, Ws-2, Wt-5, and Zdr-1 | 38 | 2 | 14,108 |
Experiment 2 | Col-0, Cvi-0, Is-1, Kz-9, Ler-1, TOU-1-17, Uk-1, and Zdr-1 | 8 | 4 | 18,559 |
Experiment 3 | Col-0 and Cvi-0 | 2 | 18 | 70,927 |