The largest repository of Arabidopsis thaliana RGB images and labels
Partners


Arabidopsis thaliana Phenotyping Datasets
This webpage provides large-scale RGB imaging datasets of various Arabidopsis thaliana ecotypes. Three high-throughput plant phenotyping experiments were conducted in a fully controlled growth chamber. The datasets include raw RGB images, manually labelled plant canopies, and individual leaf masks to facilitate open-source phenotyping data sharing.
These resources support applications such as plant trait extraction, statistical analysis, and deep learning model development for computer vision tasks such as plant segmentation, stress detection, and growth prediction. By enabling research in precision agriculture, plant development, and AI-driven phenotyping, the datasets contribute to advancing plant science and image-based plant phenotyping.
Phenotyping Experiments
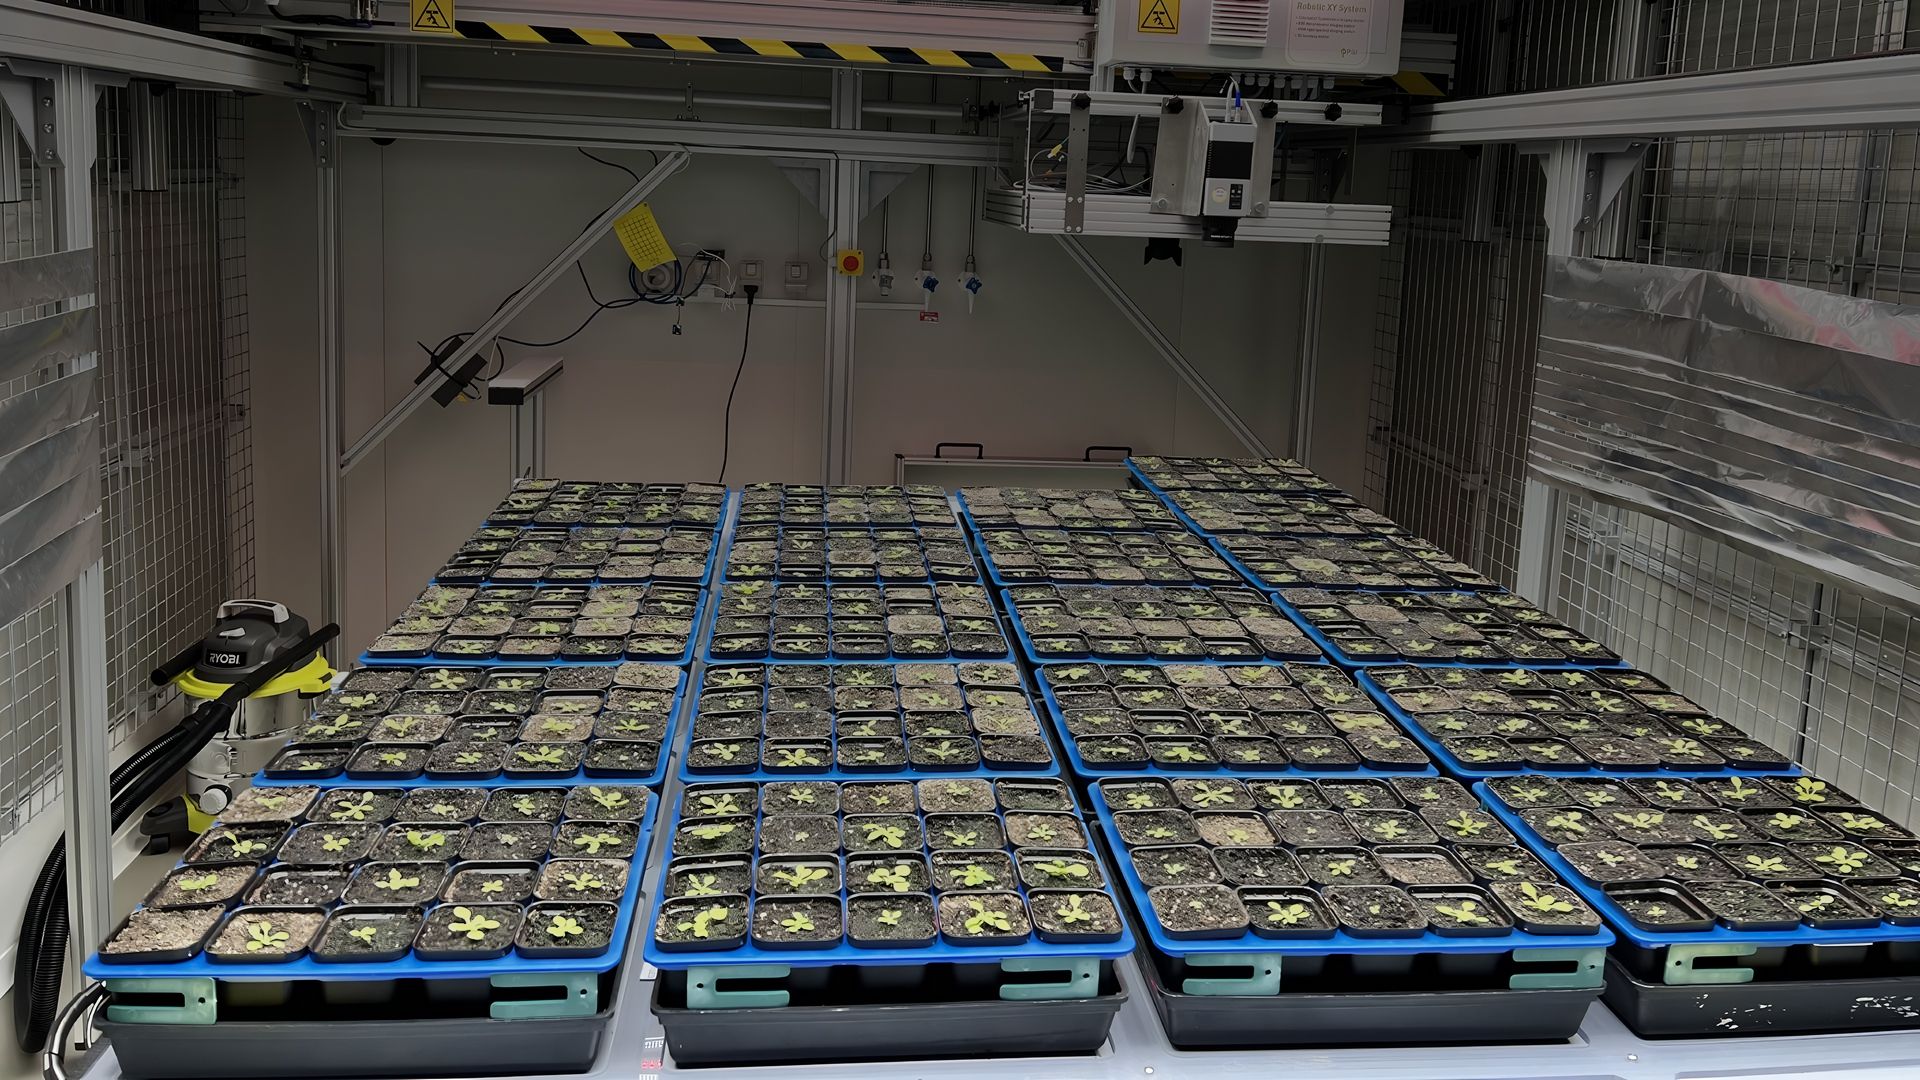
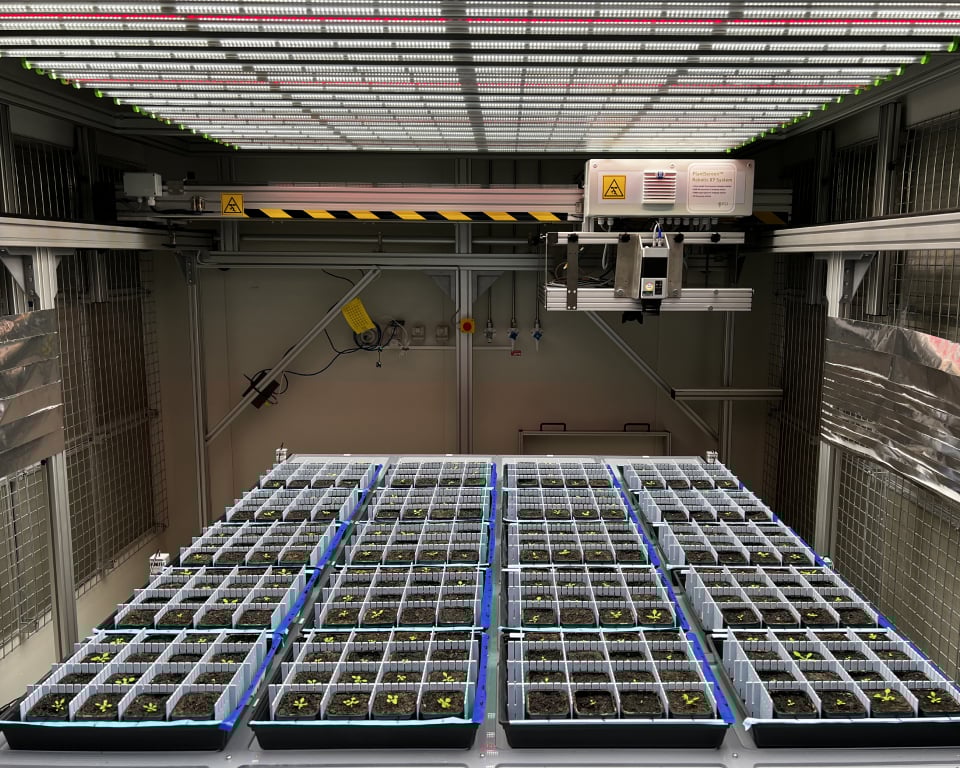
Three phenotyping experiments were conducted at La Trobe University, Australia, to extensively study Arabidopsis thaliana growth under controlled conditions, as shown in Figure 1.
The first experiment included 38 ecotypes, imaged twice daily. The second experiment focused on eight selected ecotypes, with increased imaging frequency. Both experiments used a high-throughput system with an adjustable-height table and automated top-view RGB imaging.
The third experiment, conducted earlier, utilized 30 fixed stereo cameras to capture plant growth from multiple angles over time. Environmental parameters, including light cycles and temperature, were carefully regulated across all experiments.
Data preparation involved image cropping and organization to ensure high-quality datasets for further analysis.
Read moreData Organization and Structure
The datasets include plant-level and leaf-level data collected from Arabidopsis experiments. The plant datasets (plant_ds1, plant_ds2, and plant_ds3) contain raw RGB images, while the first two also include manually labelled plant masks, as shown in Figure 2A. Plant datasets captured whole plant growth over time, with structured folders for different ecotypes and replicates.
The leaf datasets (leaf_dataset_colour, leaf_dataset1, and leaf_dataset2) provide individual leaves labelled using different colours as well as leaf binary masks, as shown in Figure 2B. These datasets focused on individual leaves, tracking both visible and occluded leaves through binary masks. Colour-coded labels ensure consistency in leaf identification throughout the plant's lifecycle. All datasets follow a hierarchical structure, allowing organized storage and retrieval of plant and leaf data.
A
B
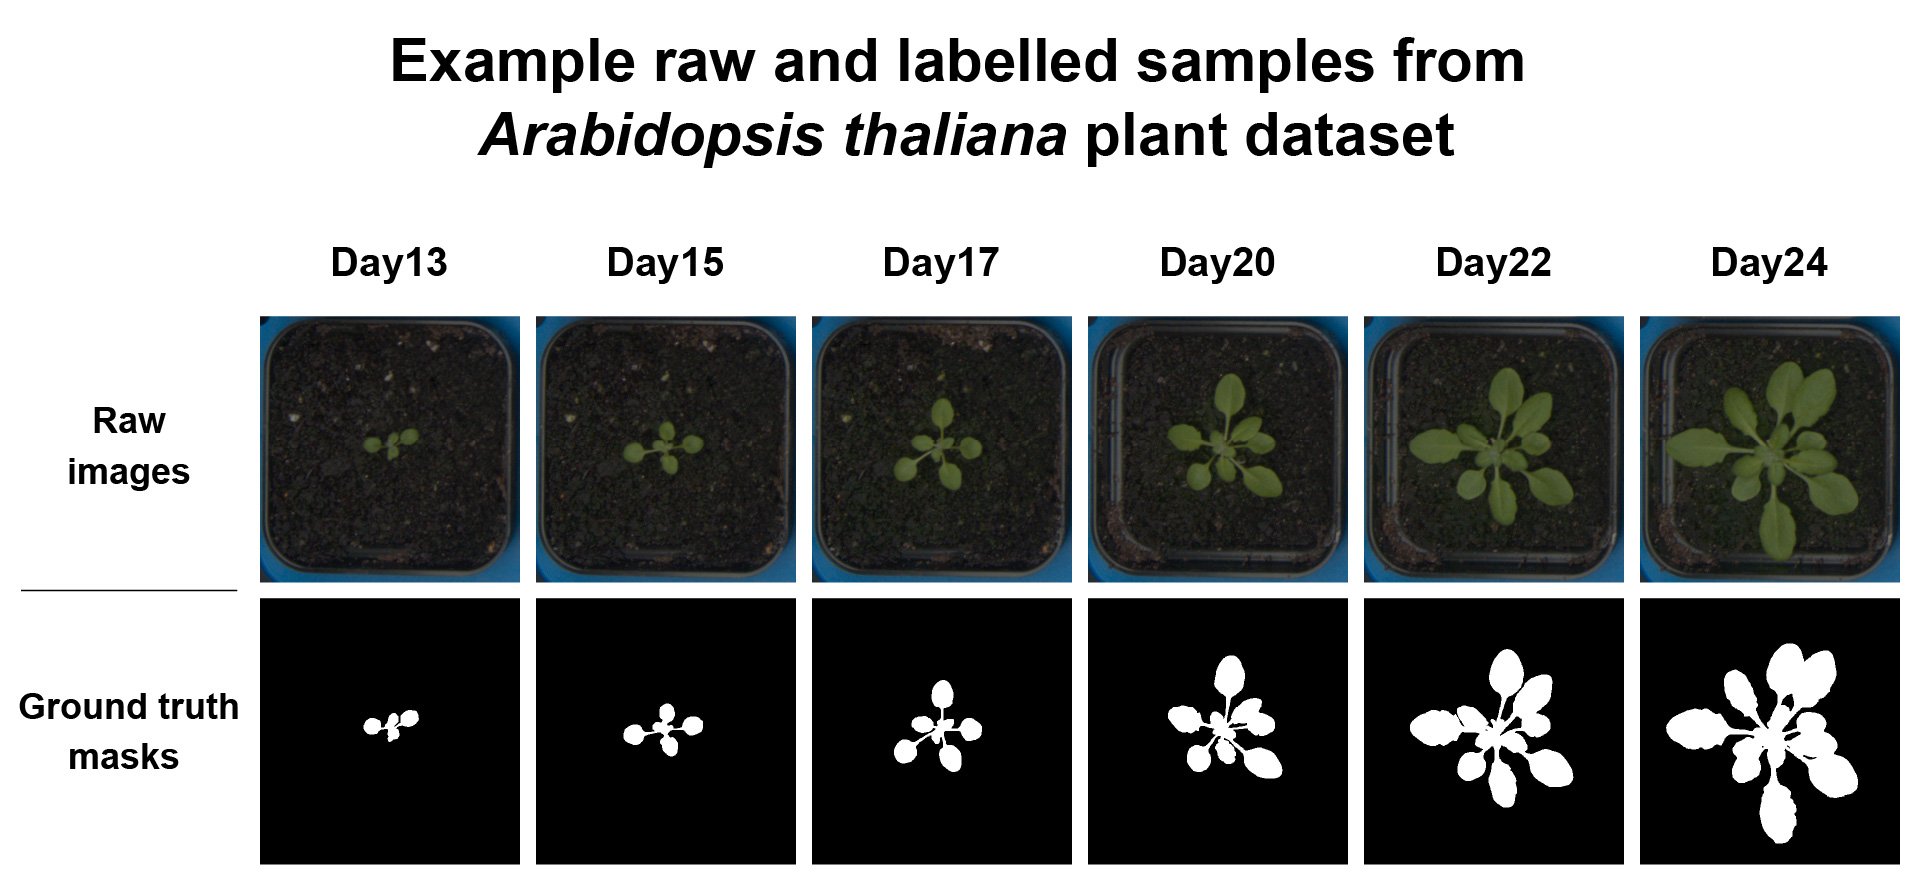
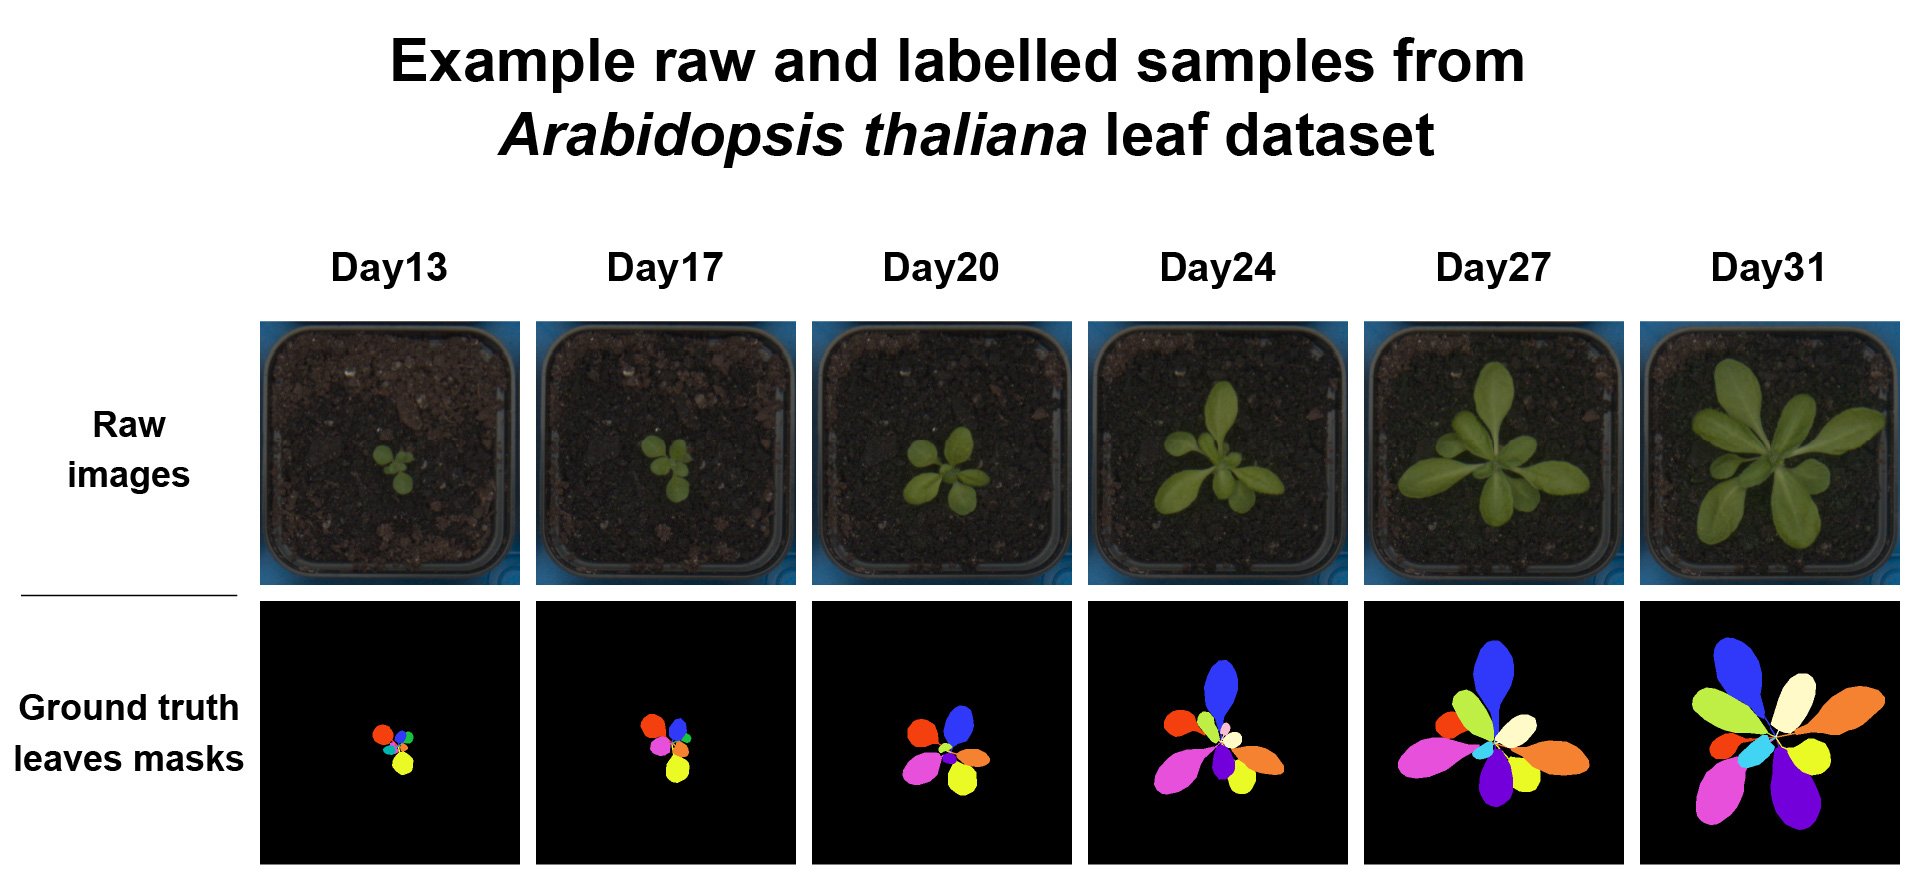
Figure 2. (A) Examples of raw RGB images of the Col-0 Arabidopsis ecotype with corresponding labels; (B) Examples of raw RGB images of the Ler-1 Arabidopsis ecotype with corresponding individual leaf labels